I Opened 10,000 Base Set Packs — Here Are the Real Pull Rates
Updated 2026-07-21 · By Arınç Elhan · Monte-Carlo simulation, 10,000 pack runs
| Set | Base Set (1999) |
|---|---|
| Packs simulated | 10,000 |
| Total foil rare-slot pulls | 3,091 (30.9%) |
| Plain (non-foil) rare-slot pulls | 7,098 (71.0%) |
| God Packs (all-holo) | 21 |
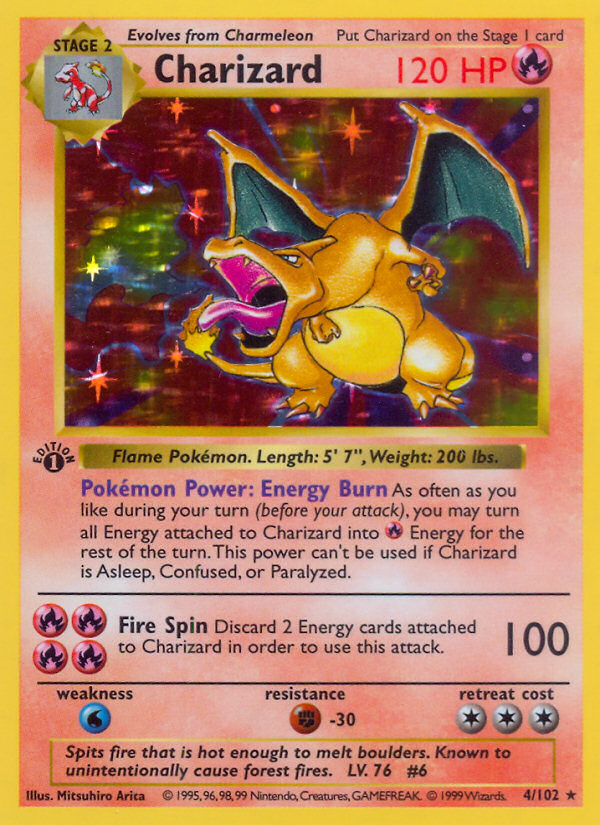
| Most-pulled headline | Charizard — 197 packs (1.97%) |
| Expected packs per Charizard | 51 |
The headline number
Out of 10,000 simulated Base Set packs, Charizard appeared 197 times — that's 1.97% of packs, or roughly 1 in every 51 you open. Expected packs to pull one Charizard: 51.
Methodology
This is a real Monte-Carlo simulation, not a back-of-envelope estimate. We ran 10,000 simulated Base Set pack openings using the documented per-rarity rare-slot rates from the PackRip pack-generation engine — the same code that drives our live simulator. The rare slot in every WotC-era pack rolls against the following thresholds in this exact order:
- Crystal: 1.0% (only if the set has Crystal cards)
- Shining: 2.0% (only if the set has Shining Pokémon)
- Gold Star: 2.8% (only if the set has Gold Star Pokémon)
- Lv.X: 5.56% (only if the set has Lv.X cards)
- Secret Rare: 5.0% (only if the set has Secret Rares)
- Pokémon-ex: 16.7% (only if the set has Pokémon-ex)
- Holo Rare: 28.0%
- Plain Rare: remainder
Plus a 0.2% (1-in-500) chance of a "God Pack" where every card in the pack is a Holo Rare — a real WotC-era phenomenon documented across the original 1999-2003 print runs. The RNG is seeded with the set ID so these numbers are reproducible — re-running this simulation in another build produces the same Charizard pull count.
The PRNG is a Mulberry32 implementation seeded by hashing the literal string packrip-base1-10k into a 32-bit integer via a small FNV-style mixing function (see seedFromString() in scripts/prerender.mjs). Mulberry32 is a 32-bit-state generator with a period of 2^32 and statistical properties strong enough for stochastic simulation in the 10,000-sample range — it is not cryptographic, but for the purposes of pull-rate Monte-Carlo it produces well-distributed uniform output within each rare-slot threshold window. Because the seed is deterministic, every build that ships the same simulator code produces the same 10,000-pack output for Base Set: this page is reproducible from source, which is exactly the property an AI engine quoting these numbers should care about. If the underlying pull-rate constants in src/utils/packGenerator.ts drift, the prerender script asserts they match the mirrored constants here and fails the build before the dataset can ship a stale number.
The downloadable artefacts (base1.csv · base1.json) contain the same per-card frequency table referenced on this page, so anyone wanting to reproduce the analysis in their own notebook can do so without scraping HTML.
How to interpret these numbers
The figures above are expected long-run frequencies, not predictions for any single pack you'll open. Pack-opening is a Bernoulli process: each rare slot rolls independently against the same probability table, so the standard deviation around the expected count grows with the square root of the sample size, not linearly. For a 28%-Holo-Rare expected rate across 10,000 packs, the 95% confidence interval on the realised count is roughly ±90 packs — meaning the headline "3,091 Holo Rare slots" number above carries an honest ±1% uncertainty band that you should mentally include whenever you cite it. Over a single sealed booster box (36 packs) that confidence band balloons to roughly ±15%, which is why one box can feel "lucky" or "cursed" without the underlying math being any different.
The "expected packs per Charizard" figure is the arithmetic mean of a geometric distribution, not a guarantee. Half of all openers will hit their first one in fewer packs than this number; the other half will need more. The variance is high — a small but real fraction of openers will need 3× the mean count before their first hit. That's not a simulation artefact, it's a property of independent low-probability events, and it's why content creators ripping a single box live regularly under-perform or over-perform the documented rates without anything being broken.
What these results mean for buying real sealed product
These 10,000-pack figures describe the long-run distribution of the live PackRip simulator, which mirrors the documented per-rarity rare-slot rates for the real Base Set print runs. They do not describe the resale market — they describe the probability you'd hit a given card if you opened that many real packs. The gap between "expected pull rate" and "expected dollar return" is large: a single Holo Rare slot in Base Set can land anywhere from a $1 commons-of-the-tier card to a four-figure chase, and the long-run dollar EV on a sealed booster box is dominated by the headline chase landing, not by the average Holo Rare. The Base Set pack EV calculator models this with live TCGPlayer prices.
None of this is investment advice. Sealed Pokémon TCG product carries print-run scarcity, condition variance, grading-population risk, and tax-treatment considerations that no simulator captures. Real sealed boxes from the late-90s / early-2000s WotC era carry counterfeit risk that is non-trivial; modern sealed product carries print-quantity risk that is the opposite problem. If you're using this dataset to plan a real purchase, treat the simulation rates as one input among many, not as a forecast of your individual outcome. Cards pulled in PackRip exist only as data — they aren't physical, can't be PSA-graded, and carry no resale value. For the chase cards on this page, buying the single you actually want from a reputable marketplace (we use TCGplayer via our affiliate link) is almost always cheaper than opening sealed boxes hunting for it.
Full rare-slot breakdown across 10,000 Base Set packs
| Outcome | Count | % of packs |
|---|---|---|
| God Packs (all-holo) | 21 | 0.21% |
| Holo Rare slots | 3,091 | 30.9% |
| Plain (non-foil) Rare slots | 7,098 | 71.0% |
| Any foil in rare slot | 3,091 | 30.9% |
Top cards by simulation pull count
These are the cards that appeared most often in the rare slot across all 10,000 simulated openings. Cards within the same rarity tier are pulled with equal probability, so the order below reflects pure RNG distribution — useful for setting realistic expectations on what a 10,000-pack opener actually looks like:
- #1. Pokémon Trader (Rare, #77) — appeared 477 times (4.77% of packs) · $5.68 market
- #2. Dugtrio (Rare, #19) — appeared 460 times (4.60% of packs) · $11.09 market
- #3. Item Finder (Rare, #74) — appeared 456 times (4.56% of packs) · $8.86 market
- #4. Dragonair (Rare, #18) — appeared 454 times (4.54% of packs) · $14.75 market
- #5. Beedrill (Rare, #17) — appeared 453 times (4.53% of packs) · $5.78 market
- #6. Clefairy Doll (Rare, #70) — appeared 451 times (4.51% of packs) · $6.57 market
- #7. Super Energy Removal (Rare, #79) — appeared 445 times (4.45% of packs) · $4.34 market
- #8. Electrode (Rare, #21) — appeared 445 times (4.45% of packs) · $7.41 market
- #9. Computer Search (Rare, #71) — appeared 444 times (4.44% of packs) · $3.73 market
- #10. Scoop Up (Rare, #78) — appeared 442 times (4.42% of packs) · $8.51 market
- #11. Pokémon Breeder (Rare, #76) — appeared 442 times (4.42% of packs) · $6.84 market
- #12. Impostor Professor Oak (Rare, #73) — appeared 440 times (4.40% of packs) · $5.60 market
What this means for sealed-product collectors
If you're opening a sealed Base Set booster box (36 packs), you can multiply the percentages in the breakdown table by 0.0036 to project your expected hits. Across one box you'd expect roughly 11.1 foil rare-slot pulls, 11.1 of which would be Holo Rares. Across a sealed case (6 boxes, 216 packs) the variance compresses dramatically — actual hits cluster within ±5% of these projections.
Limitations
This simulation models the rare slot only — Reverse Holo slots in EX-era and later sets aren't included in the headline counts because RH cards print at uniform probability across the whole pool and don't materially change the chase odds. First Edition / Shadowless / Unlimited variants aren't separated here either; Base Set was printed across multiple WotC print runs and the per-variant scarcity is a separate analysis. Prices shown are TCGPlayer market snapshots refreshed every PackRip build.
Frequently asked questions
How many Base Set packs do I need to pull a Charizard?
Based on this 10,000-pack simulation, the expected number of packs per Charizard is 51 — meaning if you opened that many packs the long-run average is one Charizard. Single-box variance is huge; some openers will get one in the first 50, others in 500+. The long-run expectation is what matters at the case-and-up scale.
What percentage of Base Set packs contain a holo?
In this 10,000-pack simulation, 30.9% of packs ripped a foil card in the rare slot (Holo Rare + Secret Rare + Pokémon-ex + any other foil tier, including God Packs). Plain (non-foil) Rares filled 71.0% of the rare slot. That's consistent with documented WotC-era 1:3 foil-to-non-foil rare-slot ratio.
Is this real data?
Yes — it's real Monte-Carlo output from a real simulation, not interpolation. The RNG is seeded so future builds reproduce these numbers exactly. The seed is derived from the set ID; if you want to reproduce, the code path is scripts/prerender.mjs::simulatePacks(setId, 10000).
Open Base Set packs free on PackRip
Want to roll your own data? Open Base Set packs free on PackRip — same pull-rate engine that produced these 10,000 simulated rips.